Dear All,

Just a quick follow-up on our discussion during the meeting yesterday:

I had another look at my code and can now tell you the following:
- As expected, the peak in the GW spectrum is generated by loops that are born during RD and that decay during MD.
- In the VOS model, the parameter \alpha(t) == \alpha_L \xi(t) indeed increases quite a bit during the RD--MD transition.
- However, in the calculation of the GW spectrum, I was erroneously evaluating \alpha(t) at some later time and not at the time of loop generation.
Consider e.g. a loop of length l at time t. Then we know that this loop was born at some time t' with length \alpha(t') t', where
\alpha(t') t' = l + \Gamma G\mu (t-t')My mistake was to evaluate \alpha at time t in this relation and simply solve for t'.
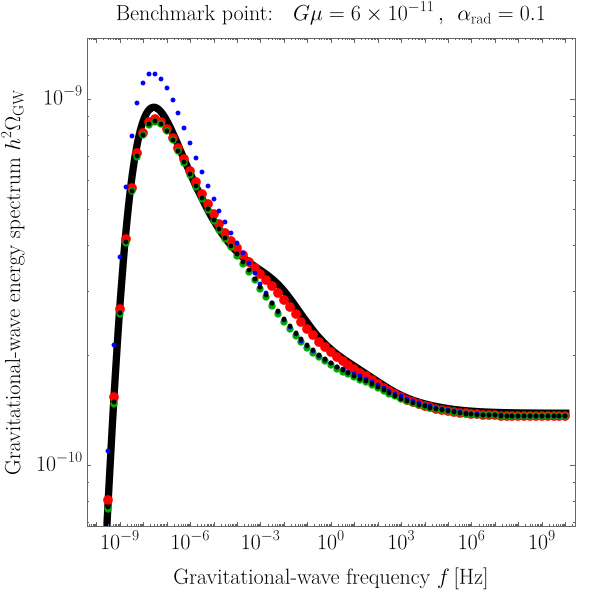
t' = ( l + \Gamma G\mu t ) / ( \alpha(t) + \Gamma G\mu )If I don't do this and correctly evaluate \alpha at time t', solving for t' becomes more complicated and needs to be done numerically. This is of course possible; and when I do this, the "blue points" I was showing to you in my plot yesterday turn into the new black points in the attached figure.
So, these new results (the black points) now almost perfectly agree with the green points (\alpha = \alpha_RD = constant, time-dependent v/xi^3 factor), which means that the time evolution of \alpha(t) has no effect on the GW spectrum.
The only noticeable effect in the VOS model is the difference between a time-dependent v/xi^3 factor (green points) and a constant v/xi^3 factor (red points). This is, however, not a new effect and perfectly agrees with the results in Geraldine's paper:
https://arxiv.org/abs/1912.02569See in particular Fig. 5, which shows the full time evolution of C_eff ~ v/xi^3 (red line, labeled "VOS") and the approximation of constant C_eff values (blue line, labeled "scaling"). The consequences of these two different approaches for the GW spectrum are shown in Fig. 4. In my code, I solve the same equations for the VOS model as in 1912.02569, and my results are fully consistent with the results shown in Fig. 4 and 5 of this paper. This explains the difference between the green (time-dependent v/xi^3) and red (piecewise constant v/xi^3) points in my plot.
Let me know if you have any questions.

Best regards, Kai.
Attachment:
vos_model.png
Description: PNG image