[Date Prev][Date Next][Thread Prev][Thread Next][Date Index][Thread Index]
[IPTA-cs] Linear interpolation of Ken's data file
- Subject: [IPTA-cs] Linear interpolation of Ken's data file
- From: Kai Schmitz <kai schmitz cern ch>
- Date: Wed, 9 Feb 2022 12:10:45 +0100
- Arc-authentication-results: i=1; mx.microsoft.com 1; spf=pass (sender ip is 188.184.36.48) smtp.rcpttodomain=cosmos.phy.tufts.edu smtp.mailfrom=cern.ch; dmarc=bestguesspass action=none header.from=cern.ch; dkim=none (message not signed); arc=none
- Arc-message-signature: i=1; a=rsa-sha256; c=relaxed/relaxed; d=microsoft.com; s=arcselector9901; h=From:Date:Subject:Message-ID:Content-Type:MIME-Version:X-MS-Exchange-AntiSpam-MessageData-ChunkCount:X-MS-Exchange-AntiSpam-MessageData-0:X-MS-Exchange-AntiSpam-MessageData-1; bh=xCfsNLd6CwRLDlpHQJj7IL9kbCAeYjBIsKOqMCAiKp8=; b=g5JpjxjBvOk60CUH6XmWHbjX7cYh2OuY27R6KyWpKoVNIW9b/0MXlcm+p86sI8FFx6QKjtZqoBsOV2JP9Yas+jR52pDDjOh5NamCwiBSqo+LBwuSi+r/HceoFWJuDwFmsDIN0LP0upYRwvLX2WcjLpvNaSGnExCRLRcPr4y87N3hoH4bd5v1D2iggmFJxpDvgQFPOVttjpW723tnP8ATxuJRRlen2CScvk+3PGO0ArxlY1b/DEyiMkhCgVlYB4o+l+AWHrX+5VSz8LJxdhxinROoVS5vHg9KBj1n1+XPBaCWEA53YdPbHnxs8MDPzGHsgMPC9A/oWb7ezCe3vf6FJg==
- Arc-seal: i=1; a=rsa-sha256; s=arcselector9901; d=microsoft.com; cv=none; b=jdj/MYIwtMDW/KoKQieBQx+aRMB/aVvOuUHxrrQT5Kud8+P6EIh1fC3UvRXPi12HZeyOwqEBo9J0ZLSDYpHbjp+1VrcYR1olO5Pg1Wt+J0vbvsVExCRYmDDGpc5Ns6zqLWiZOwzzl8wUJnJ2jrQN0oyL0kBqp/vcWeW3XqtVLnxxvrjFhgVMRiA6O6AxcYswB0WukSTNXwstuGiJ/wO+gr4EwCvgHOB0IK5SQiVUuuhpTDiqpJcYjhIvJeyxjse4KH90fwYF8/kaJFIkrBVo5eL5gcpomhVoYEPQWcmpCj6lq7OOmwUgz9ONgo1bMAGNdeeo7hzofSO+AsVFnf+U1Q==
- Dkim-signature: v=1; a=rsa-sha256; c=relaxed/relaxed; d=cern.onmicrosoft.com; s=selector2-cern-onmicrosoft-com; h=From:Date:Subject:Message-ID:Content-Type:MIME-Version:X-MS-Exchange-SenderADCheck; bh=xCfsNLd6CwRLDlpHQJj7IL9kbCAeYjBIsKOqMCAiKp8=; b=IPNj9Ve4thM9z9/+ixXQfSTb7/DM4SN0WSMM9tfep6cZGdqwFvvk8kiSbS2x+Jy8Y+nCKXXnhstwhQVecAdNv1/NsVSxaL/pGP41Eh16EqSBIEAmUkHQuqwMDTk7GbinyxleZSDj6BLDSXlu0ktUaVfVfDA/dzdedOKVrPrgaCs=
- In-reply-to: <1a393632-866a-fde4-066e-e37fc6fd919f@cern.ch>
- List-archive: <http://cosmos.phy.tufts.edu/mhonarc/ipta-cosmic-strings/>
- List-help: <mailto:ipta-cosmic-strings-request@cosmos.phy.tufts.edu?subject=help>
- List-id: International Pulsar Timing Array cosmic strings group <ipta-cosmic-strings.cosmos.phy.tufts.edu>
- List-post: <mailto:ipta-cosmic-strings@cosmos.phy.tufts.edu>
- List-subscribe: <https://cosmos.phy.tufts.edu/mailman/listinfo/ipta-cosmic-strings>, <mailto:ipta-cosmic-strings-request@cosmos.phy.tufts.edu?subject=subscribe>
- List-unsubscribe: <https://cosmos.phy.tufts.edu/mailman/options/ipta-cosmic-strings>, <mailto:ipta-cosmic-strings-request@cosmos.phy.tufts.edu?subject=unsubscribe>
- References: <1579cf2e-a39f-ad02-9451-6dc78364cbaa@cern.ch> <1a393632-866a-fde4-066e-e37fc6fd919f@cern.ch>
- User-agent: Mozilla/5.0 (X11; Linux x86_64; rv:91.0) Gecko/20100101 Thunderbird/91.5.0
Hi All,
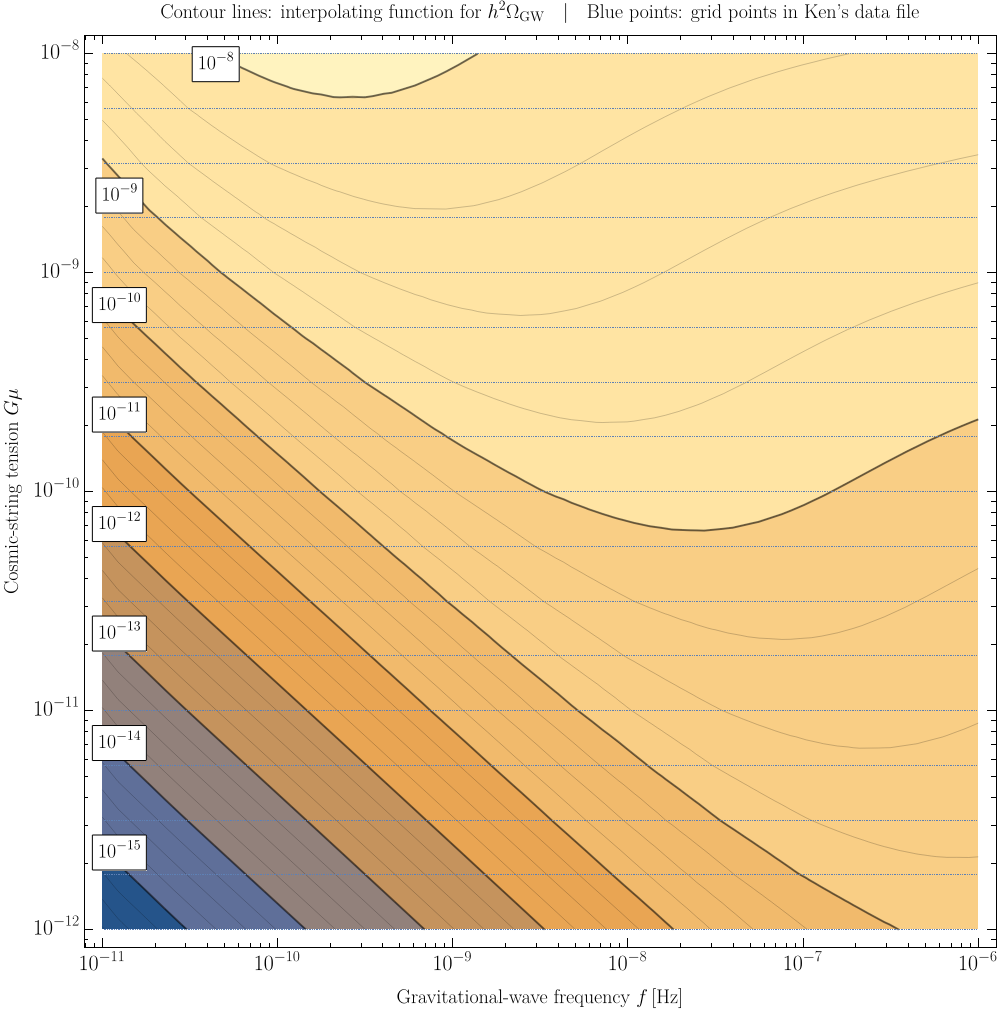
Let me share a figure with you that I also just posted in our Slack
channel. Attached to this mail, you'll find a contour plot of the
interpolating function for h^2 \Omega that I constructed based on Ken's
data file. This function lives in the 2D parameter space spanned by the
GW frequency f and the cosmic-string tension Gmu. Or referring to Ken's
data file, one could say: the contour plot in the attachment shows
interpolated values for the quantity in the third column in Ken's file
in dependence on the quantities in the first and second columns in Ken's
file.
The main message from the plot is: Mathematica's "Interpolation" command
gives us a smooth and well-behaved interpolating function -- simply a
linear interpolation in log-log-log space -- which we can use to compute
the GW signal in the 30 IPTA frequency bins; see the two look-up tables
I shared on Slack.
Let me know if you have got questions on the plot, or if I can help with
the implementation into ENTERPRISE. For instance, let me know if you
preferred to have a look-up table in a different format.
Thanks a lot and talk to you soon.

Best regards, Kai.
PS: I posted another, global version of the plot on Slack, which shows
the function across the entire range of f and Gmu values in Ken's file.
It's not attached to this email because of size restrictions.
Attachment:
interpolation_local.png
Description: PNG image