The Evolution of the Rest-frame J- and H-band
Luminosity Function of Galaxies to z=3.5
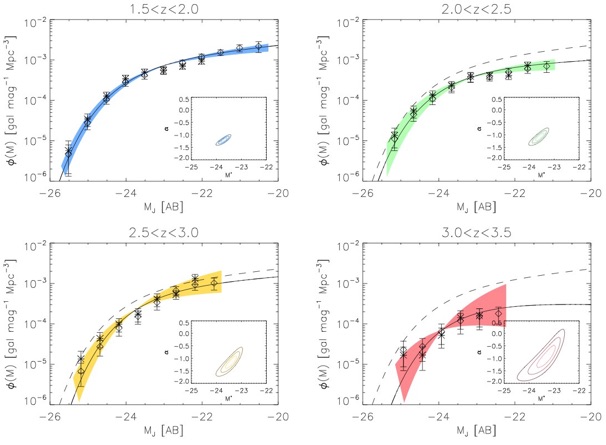
FIG.1. Luminosity function for the rest-frame J band, in the four redshift bins. Asterisks represent the 1/Vmax measurement, diamonds are from the SWML. The Schechter function obtained via the maximum likelihood is shown as the solid black line. The colored area in each plot indicates the 1σ (68% confidence level) from the parametric maximum likelihood. The inset shows the 1, 2 and 3σ contours (corresponding to 68%, 95% and 98% confidence region) for the joint α-M∗ parameters from the ML analysis. The dashed line marks our 1.5<z<2.0 LF.
Maximum-likelihood measurements (adopting a Schechter 1976 function)
[Table 1 and 2 from Stefanon & Marchesini 2011]:
1/Vmax measurements [see Table 3 and 4 from Stefanon & Marchesini 2011]:
J-band: 1.5<z<2.0, 2.0<z<2.5, 2.5<z<3.0, 3.0<z<3.5
H-band: 1.5<z<2.0, 2.0<z<2.5, 2.5<z<3.0, 3.0<z<3.5
Step-wise maximum-likelihood measurements [see Table 3 and 4 from Stefanon & Marchesini 2011]:
J-band: 1.5<z<2.0, 2.0<z<2.5, 2.5<z<3.0, 3.0<z<3.5
H-band: 1.5<z<2.0, 2.0<z<2.5, 2.5<z<3.0, 3.0<z<3.5
Luminosity density measurements [see Table 5 from Stefanon & Marchesini 2011]:
Please, cite Stefanon & Marchesini (2011) for any publications using these data (downloadable below).
ABSTRACT: We present the rest-frame J- and H- band luminosity function (LF) of field galaxies, based on a deep multi-wavelength composite sample from the MUSYC, FIRES and FIREWORKS survey public catalogues, covering a total area of 450 arcmin2. The availability of flux measurements in the Spitzer IRAC 3.6, 4.5, 5.8, and 8 μm channels allows us to compute absolute magnitudes in the rest-frame J and H bands up to z=3.5 minimizing the dependence on the stellar evolution models. We compute the LF in the four redshift bins 1.5<z<2.0, 2.0<z<2.5, 2.5<z<3.0 and 3.0<z<3.5. Combining our results with those already available at lower redshifts, we find that (1) the faint end slope is consistent with being constant up to z=3.5, with α=−1.05±0.03 for the rest-frame J band and α=−1.15±0.02 for the rest-frame H band; (2) the normalization φ* decreases by a factor of 4-6 between z=0 and z≃1.75 and by a factor of 2-3 between z≃1.75 and z=3.25; (3) the characteristic magnitude M* shows a brightening from z=0 to z≃2 followed by a slow dimming to z=3.25. We finally compute the luminosity density (LD) in both rest-frame J and H bands. The analysis of our results together with those available in the literature shows that the LD is approximately constant up to z≈1, and it then decreases by a factor of 6 up to z=3.5.
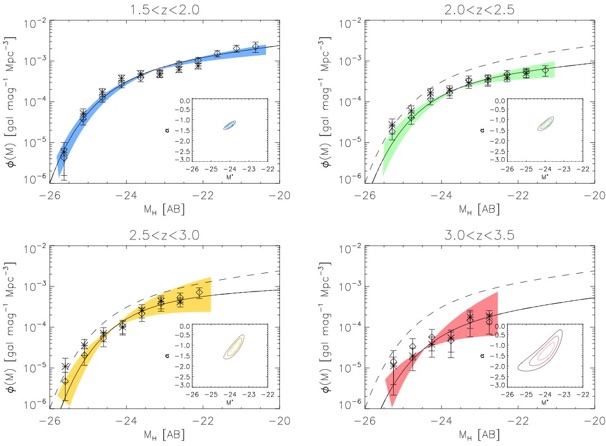
FIG.2. Luminosity function for the rest-frame H band, in the four redshift bins.
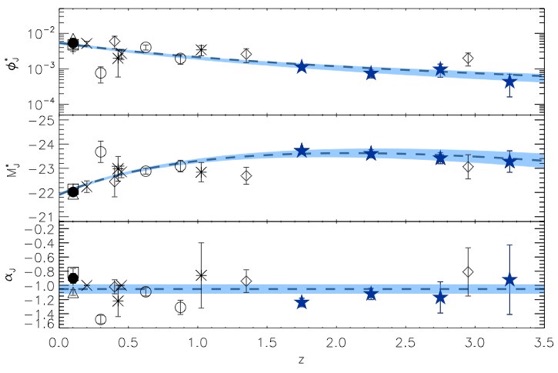
FIG.3. Evolution of the Schechter parameters of the J LF as a function of redshift. Estimates from this work are shown as filled blue stars. Measurements from the literature are also plotted (vertical crosses: Cole et al. 2001; asterisks: Pozzetti et al. 2003; crosses: Feulner et al. 2003; open squares: Eke et al. 2005; open circles: Dahlen et al. 2005; open diamonds: Saracco et al. 2006; open triangles: Jones et al. 2006; filled circle: Hill et al. 2010). Top panel shows the data for φ∗. The middle panel presents the measurements for M∗; in the lower panel the faint end slopes α together with the average value (dashed line) are shown. The filled regions correspond to 95% confidence level intervals for the resulting fitting curves.
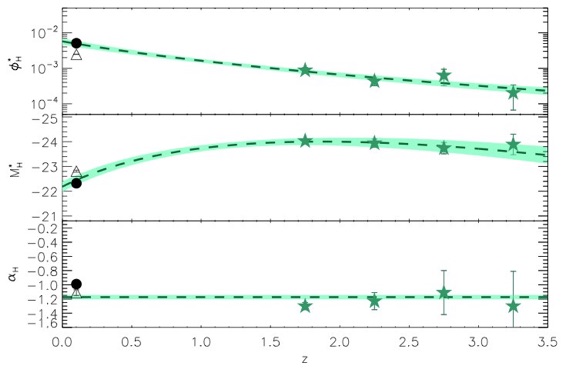
FIG.4. Evolution of the Schechter φ∗, M∗ and α parameters from the H LF as a function of redshift.
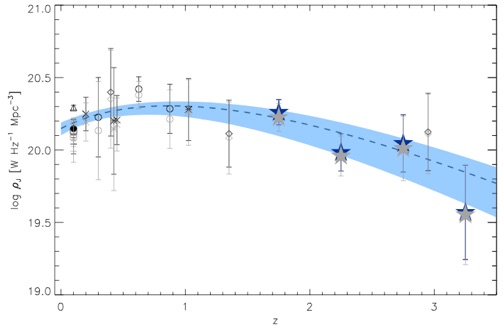
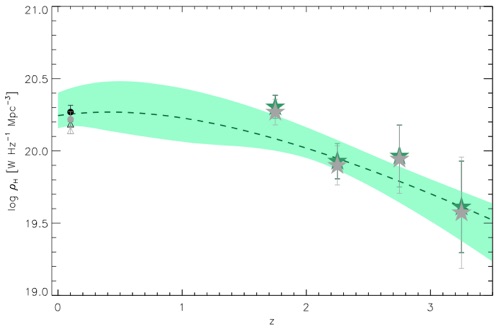
FIG.5. Top panel: Luminosity density ρJ as computed from our Schechter parameters (filled blue stars) and compared with the available data in the redshift range [0,3.0]. Grayed symbols indicate the luminosity density computed assuming an absolute magnitude limit of MJ=−20.0. The dashed line represents the fitted LD, with 95% confidence level indicated by the filled region. Bottom panel: Luminosity density ρH as computed from our Schechter parameters (filled black stars) and compared with the available data.