The Evolution of the Stellar Mass Functions of Star-forming and Quiescent Galaxies to z=4 from the COSMOS/ULTRAVISTA Survey
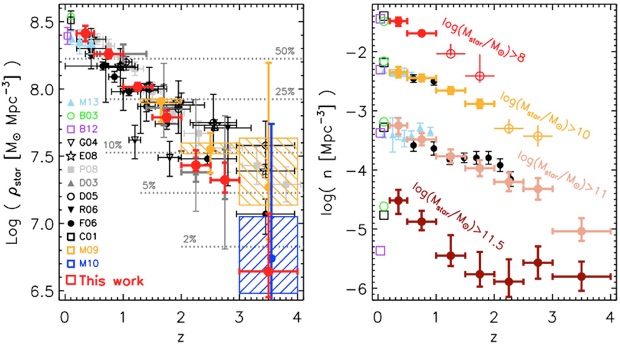
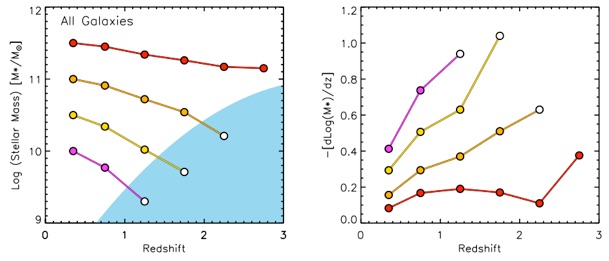
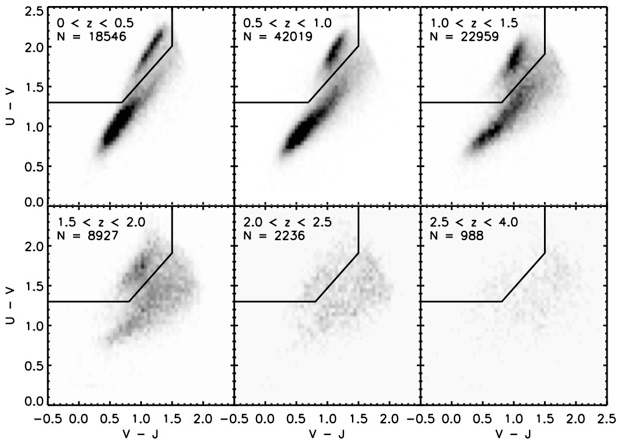
FIG.1. UVJ color-color diagram at various redshifts for galaxies more massive than the 95% mass-completeness limits. The bimodality in the galaxy population is clearly visible up to z=2. The cuts used to separate star forming from quiescent galaxies for the SMFs are shown as the solid lines.
Please, cite Muzzin et al. (2013) for any publications using these data (downloadable below).
ABSTRACT: We present measurements of the stellar mass functions (SMFs) of star-forming and quiescent galaxies to z=4 using a sample of 95,675 galaxies in the COSMOS/UltraVISTA field. Sources have been selected from the DR1 UltraVISTA Ks-band imaging which covers a unique combination of a wide area (1.62 deg2), to a significant depth (Ks,tot=23.4, 90% completeness). The SMFs of the combined population are in good agreement with previous measurements and show that the stellar mass density of the universe was only 50%, 10% and 1% of its current value at z∼1.0, 2.0, and 3.5, respectively. The quiescent population drives most of the overall growth, with the stellar mass density of these galaxies increasing by 0.64+0.03-0.03, 1.46+0.07-0.07, and 2.71+0.93-0.22 dex since z=1.0, 2.0, and 3.5, respectively. By contrast, the mass density of star-forming galaxies grows by 0.40+0.03-0.03, 0.87+0.13-0.06, and 1.59+0.49-0.20 dex over the same redshift range. At z>2.5, star-forming galaxies dominate the total SMF at all stellar masses, although a nonzero population of quiescent galaxies persists to z=4. Comparisons of the Ks-selected star-forming galaxy SMFs to UV-selected SMFs at 2.5<z<4 show reasonable agreement and suggests UV-selected samples are representative of the majority of the stellar mass density at z>3.5. We estimate the average mass growth of individual galaxies by selecting galaxies at fixed cumulative number density. The average galaxy with Log(Mstar/M⊙)=11.5 at z=0.3 has grown in mass by only 0.2 dex (0.3 dex) since z=2.0(3.5), whereas those with Log(Mstar/M⊙)=10.5 have grown by >1.0 dex since z=2. At z<2, the time derivatives of the mass growth are always larger for lower-mass galaxies, which demonstrates that the mass growth in galaxies since that redshift is mass-dependent and primarily bottom-up. Lastly, we examine potential sources of systematic uncertainties on the SMFs and find that those from photo-z templates, SPS modeling, and the definition of quiescent galaxies dominate the total error budget in the SMFs.
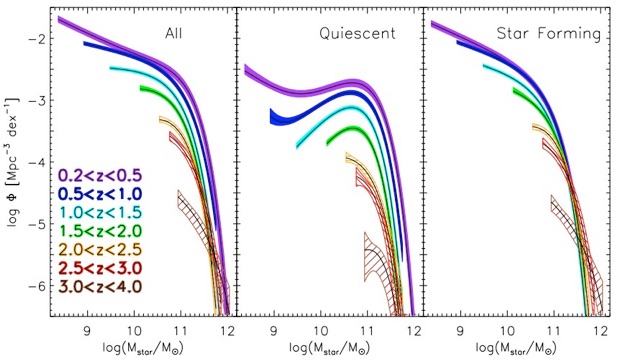
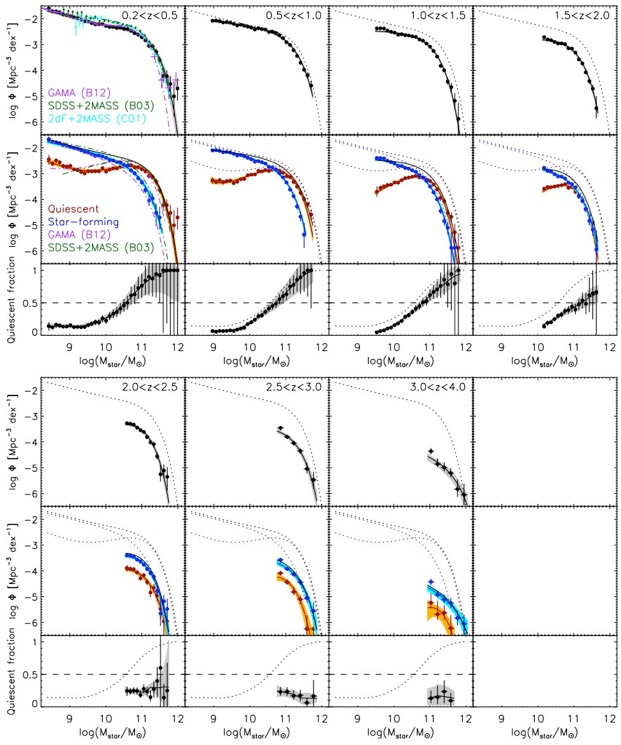
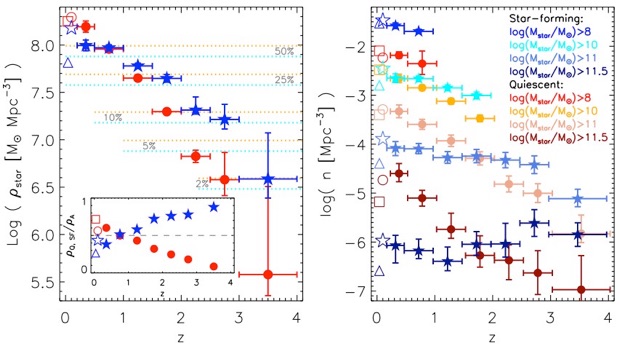
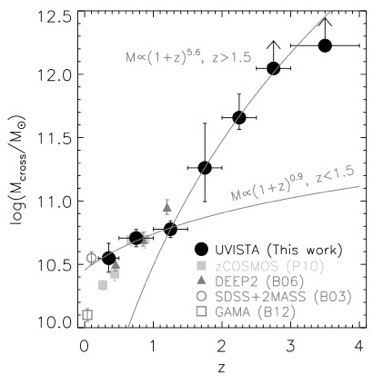
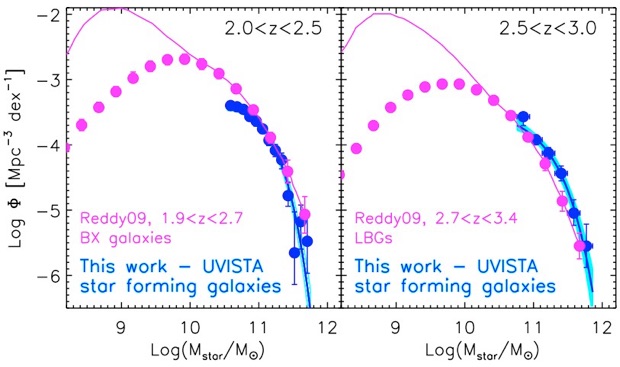
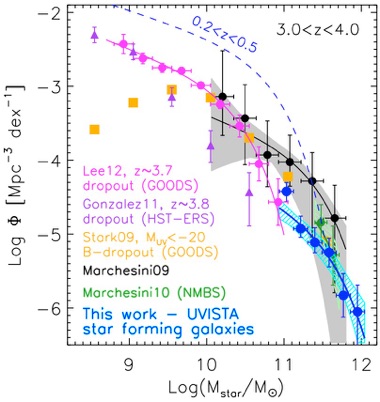
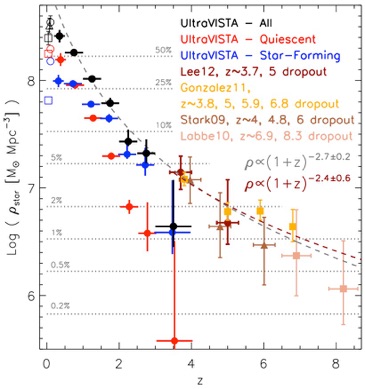
FIG.2. Stellar mass functions of all galaxies, quiescent galaxies, and star-forming galaxies in different redshift intervals. The shaded/hatched regions represent the total 1σ uncertainties of the maximum-likelihood analysis, including cosmic variance and the errors from photometric uncertainties as derived using the MC realizations. The normalization of the SMF of quiescent galaxies evolves rapidly with redshift, whereas the normalization for star-forming galaxies evolves relatively slowly. In particular, there is almost no change at the high-mass end of the star forming SMF, whereas there is clear growth at the high-mass end of the quiescent population. There is also evidence for evolution of the low-mass end slope for quiescent galaxies. At low-redshift a double Schechter function fit is required to reproduce the total SMF.
FIG.3. Top panels: The SMFs of all galaxies in different redshift bins from 0.2<z<4.0. The black points represent the SMFs determined using the 1/Vmax method and the black solid curves are the SMFs determined using the maximum-likelihood method. The gray shaded regions represent the total 1σ uncertainties of the maximum-likelihood analysis, including cosmic variance and the errors from photometric uncertainties as derived from the MC simulations. Over-plotted in the 0.2<z<0.5 bin are the SMFs from Cole et al. (2001), Bell et al. (2003), and Baldry et al. (2012). In the remaining redshift bins the dotted curve is the total SMF from UltraVISTA in the 0.2<z<0.5 bin. Middle panels: SMFs as with the top panels, but for the quiescent galaxies (red points, red solid curves) and star-forming galaxies (blue points, blue solid curve). The orange and cyan shaded regions represent the total 1σ uncertainties of the maximum-likelihood analysis for quiescent and star-forming galaxies, respectively. Bottom panels: Fraction of quiescent galaxies as a function of Mstar.
FIG.4. Left panel: The evolution of the stellar mass density of galaxies from z=4 to z=0 down to a limit of log(Mstar/M⊙)=8.0. The UltraVISTA measurements are shown in red with error bars representing total 1σ random errors inclusive of cosmic variance and the errors from photometric uncertainties as derived using the MC simulations. Other measurements from the literature are shown and agree well with the UltraVISTA measurements within the uncertainties. Right panel: The evolution of the number density of galaxies above a fixed mass limit from UltraVISTA. Open circles denote extrapolations of the Schechter function beyond the data. Black and light blue points are from the NMBS Brammer et al. (2011) and PRIMUS (Moustakas et al. 2013) surveys and agree well with the UltraVISTA measurements.
FIG.5. Left panel: The evolution of the stellar mass density of star forming (blue) and quiescent (red) galaxies as a function of redshift with error bars representing total 1σ random errors inclusive of cosmic variance and the errors from photometric uncertainties as derived using the MC simulations. At low-redshift the measurements from Bell et al. (2003) (circle and star) and Baldry et al. (2012) (square and triangle) are shown. The mass density in quiescent galaxies evolves faster than the mass density in star-forming galaxies, particularly at high redshift. Although they dominate the high-mass end of the mass function at z<2.5, quiescent galaxies do not dominate the overall mass density of the universe until z<0.75 due to a much shallower low-mass-end slope. Right panel: Evolution of the number densities of star forming and quiescent galaxies at a fixed mass limit as a function of redshift.
FIG.6. The Mstar at which quiescent galaxies dominate over star-forming galaxies (Mcross) as a function of redshift. Measurements from other surveys are shown and agree reasonably well with the UltraVISTA measurement. Quiescent galaxies dominate the high-mass end of the SMF up to z∼1.5. Thereafter star-forming galaxies quickly become dominant at all Mstar.
1/Vmax measurements [from Muzzin et al. 2013]:
0.2<z<0.5, 0.5<z<1.0, 1.0<z<1.5, 1.5<z<2.0, 2.0<z<2.5, 2.5<z<3.0, 3.0<z<4.0
Maximum-likelihood measurements (adopting a Schechter 1976 function) [Table 1 from Muzzin et al. 2013]:
Number and stellar mass density measurements [Tables 2 from Muzzin et al. 2013]:
Measurements of quiescent fractions [bottom panels of Figure 6 in Muzzin et al. 2013]
1/Vmax measurements: 0.2<z<0.5, 0.5<z<1.0, 1.0<z<1.5, 1.5<z<2.0, 2.0<z<2.5, 2.5<z<3.0, 3.0<z<4.0
Maximum-likelihood measurements: 0.2<z<0.5, 0.5<z<1.0, 1.0<z<1.5, 1.5<z<2.0, 2.0<z<2.5, 2.5<z<3.0, 3.0<z<4.0
1/Vmax measurements for the different SED-modeling assumptions and UVJ selection of quiescent and star-forming galaxies:
Maraston (2005): 0.2<z<0.5, 0.5<z<1.0, 1.0<z<1.5, 1.5<z<2.0, 2.0<z<2.5, 2.5<z<3.0, 3.0<z<4.0
Delayed exponentially declining SFH: 0.2<z<0.5, 0.5<z<1.0, 1.0<z<1.5, 1.5<z<2.0, 2.0<z<2.5, 2.5<z<3.0, 3.0<z<4.0
Free metallicity: 0.2<z<0.5, 0.5<z<1.0, 1.0<z<1.5, 1.5<z<2.0, 2.0<z<2.5, 2.5<z<3.0, 3.0<z<4.0
Dusty template: 0.2<z<0.5, 0.5<z<1.0, 1.0<z<1.5, 1.5<z<2.0, 2.0<z<2.5, 2.5<z<3.0, 3.0<z<4.0
D(U-V)=+0.1 and D(V-J)=-0.1: 0.2<z<0.5, 0.5<z<1.0, 1.0<z<1.5, 1.5<z<2.0, 2.0<z<2.5, 2.5<z<3.0, 3.0<z<4.0
D(U-V)=-0.1 and D(V-J)=+0.1: 0.2<z<0.5, 0.5<z<1.0, 1.0<z<1.5, 1.5<z<2.0, 2.0<z<2.5, 2.5<z<3.0, 3.0<z<4.0
Maximum-likelihood measurements (adopting a Schechter 1976 function) for the different SED-modeling assumptions [Table 3 from Muzzin et al. 2013] and UVJ selection of quiescent and star-forming galaxies [Table 4 from Muzzin et al. 2013]:
Maraston (2005): ALL, QUIESCENT, STAR-FORMING
Delayed exponentially declining SFH: ALL, QUIESCENT, STAR-FORMING
Free metallicity: ALL, QUIESCENT, STAR-FORMING
Dusty template: ALL, QUIESCENT, STAR-FORMING
D(U-V)=+0.1 and D(V-J)=-0.1: QUIESCENT, STAR-FORMING
D(U-V)=-0.1 and D(V-J)=+0.1: QUIESCENT, STAR-FORMING
FIG.7. Left Panel: Comparison of the UltraVISTA star forming SMF at 2.0<z<2.5 and the BM/BX-selected SMF from Reddy & Steidel (2009). The SMFs show good agreement at the high-mass end but the UltraVISTA SMF suggests a shallower low-mass-end slope than the BM/BX SMF. Right Panel: Comparison of the UltraVISTA star forming SMF at 2.5<z<3.0 and the LBG-selected SMF from Reddy & Steidel (2009). These show reasonable agreement at the high-mass end, although the UltraVISTA SMF suggests that the LBG selection may miss ~50% of the massive galaxy population in this redshift range.
FIG.8. Comparison of the KS-selected SMF of star-forming galaxies at 3.0<z<4.0 from UltraVISTA (blue) and other SMF in the literature. The Marchesini et al. (2009) and Marchesini et al. (2010) SMFs are also KS-selected samples and agree well with the UltraVISTA SMF. The Stark et al. (2009); Gonzalez et al. (2011), and Lee et al. (2012) SMFs are UV-selected. These agree reasonably well with UltraVISTA at Log(Mstar/M⊙)=11.0, but it appears the UV-selection may miss the most massive galaxies in this redshift range.
FIG.9. Evolution of the stellar mass density in the universe between z=0–8.5. The SMDs determined from UV-selected samples are shown at z>3.5. Below z<3.5 the KS-selected SMDs from UltraVISTA are shown for the total (black), star forming (blue) and quiescent (red) populations. The z∼0 data from Cole et al. (2001) (triangle), Bell et al. (2003) (circles) and Baldry et al. (2012) (squares) are also shown. The SMD in star-forming galaxies from the KS-selected and UV-selected samples agrees to within 1σ suggesting that UV-selected samples account for most of the SMD at z>3.5. The dashed gray curve shows a simultaneous fit to the total SMD from UltraVISTA at z>1.5 and the UV-selected samples, and the dashed maroon shows a fit to just the UV-selected samples, both of which agree well.
FIG.10. Left panel: Average stellar mass of galaxies chosen at a fixed cumulative number density from the Schechter function fits. The cumulative number densities are chosen so that they correspond to galaxies with Log(Mstar/M⊙)=11.5, 11.0, 10.5, and 10.0 in the lowest-redshift SMF. The shaded blue region represent regions that require extrapolating the Schechter function beyond the depth of the data. Right panel: Derivatives of the growth in stellar mass as a function of redshift. The derivatives separate into a sequence showing that the rate mass growth is always larger for lower-mass galaxies at z<2.