The Evolution of the Rest-frame V-band Luminosity Function from z=4: A Constant Faint-end Slope over the Last 12 Gyr of Cosmic History
FIG.1: Rest-frame V-band LFs of galaxies at 0.4 ≤ z < 4.0. Black filled circles are the 1/Vmax method estimates with total 1-σ error bars. The black solid curves are the LFs estimated with the maximum-likelihood method. The shaded gray regions represent the 1-, 2-, and 3-σ uncertainties of the LF estimated from the maximum-likelihood method. The blue and red dot-dashed curves show the LFs measured in the adjacent lower and higher redshift interval, to highlight the evolution with redshift of the LF. The dot-dashed cyan curve represents the local (z ∼ 0.1) LFs in the rest-frame 0.1r band (similar to our rest-frame V band) from the SDSS (Montero-Dorta & Prada 2009) and the GAMA survey (Loveday et al. 2011). The vertical arrows indicate the approximate 90% completenesses in rest-frame V -band magnitude of the catalogs used in our work.
1/Vmax measurements:
0.40<z<0.70, 0.76<z<1.10, 1.10<z<1.50, 1.50<z<2.10, 2.10<z<2.70, 2.70<z<3.30, 3.30<z<4.00
Maximum-likelihood measurements (adopting a Schechter 1976 function):
0.40<z<0.70, 0.76<z<1.10, 1.10<z<1.50, 1.50<z<2.10, 2.10<z<2.70, 2.70<z<3.30, 3.30<z<4.00
Please, cite Marchesini et al. (2012) for any publications using these data (downloadable below).
ABSTRACT: We present the rest-frame V -band luminosity function (LF) of galaxies at 0.4 ≤ z < 4.0, measured from a near-infrared selected sample constructed from the NMBS, the FIRES, the FIREWORKS, and the ultra-deep NICMOS and WFC3 observations in the HDFN, HUDF, and GOODS-CDFS, all having high-quality optical to mid-infrared data. This unique sample combines data from surveys with a large range of depths and areas in a self-consistent way, allowing us to (1) minimize the uncertainties due to cosmic variance; and (2) simultaneously constrain the bright and faint ends with unprecedented accuracy over the targeted redshift range, probing the LF down to 0.1 L⋆ at z ∼ 3.9. We find that (1) the faint end is fairly flat and with a constant slope from z = 4, with α = −1.27 ± 0.05; (2) the characteristic magnitude has dimmed by 1.3 mag from z ∼ 3.7 to z = 0.1; (3) the characteristic density has increased by a factor of ∼ 8 from z ∼ 3.7 to z = 0.1, with 50% of this increase from z ∼ 4 to z ∼ 1.8; and (4) the luminosity density peaks at z ≈ 1−1.5, increasing by a factor of ∼ 4 from z = 4.0 to z ≈ 1 − 1.5, and subsequently decreasing by a factor of ∼ 1.5 by z = 0.1. We find no evidence for a steepening of the faint-end slope with redshift out to z = 4, in contrast with previous observational claims and theoretical predictions. The constant faint-end slope suggests that the efficiency of stellar feedback may evolve with redshift. Alternative interpretations are discussed, such as different masses of the halos hosting faint galaxies at low and high redshifts and/or environmental effects.
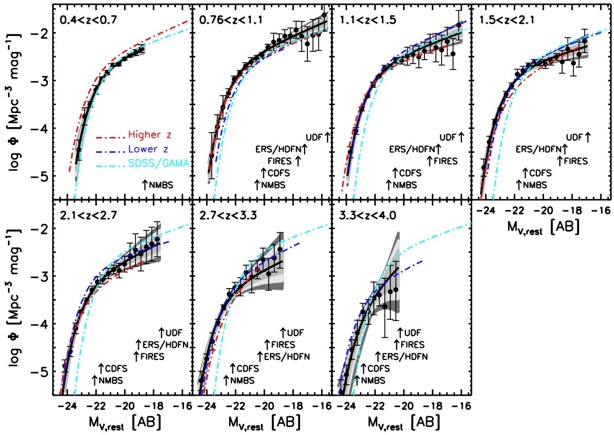
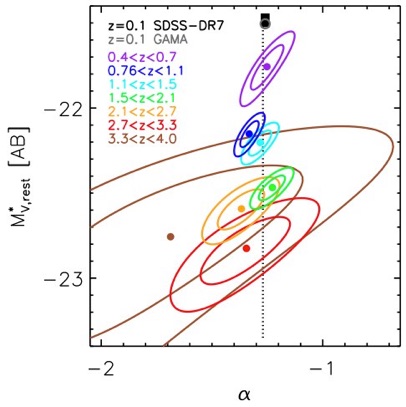
FIG.2: (α-M*V) parameter space derived from the maximum likelihood analysis. Filled circles are the best-fit values of α and M*V derived in our work, while the curves represent their 1σ and 2σ contour levels. The black filled square represents the redshift z ∼ 0.1 value from the SDSS- DR7 (Montero-Dorta & Prada 2009), whereas the empty gray circle represents the redshift z ∼ 0.1 value from the GAMA survey (Loveday et al. 2011). The dotted line represents the weighted average of the plotted measurements (α = -1.27 ± 0.05).
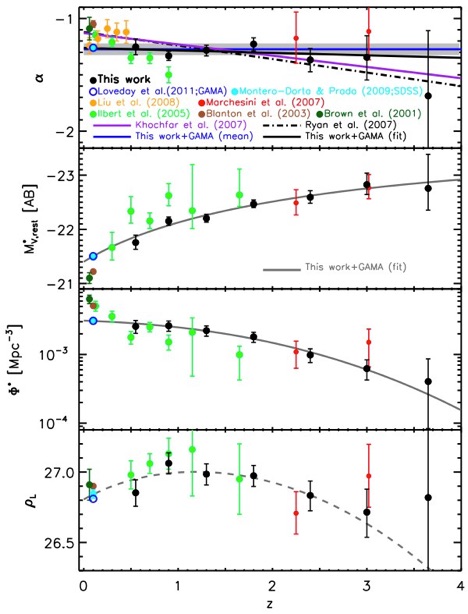
FIG.3: Evolution of the Schechter (1976) function parameters (α, M*V, and Φ*, top three panels), and the luminosity density (bottom panel) with redshift. Filled black circles are the values derived in this work. Filled dark green, green, red, and orange circles are the values from Brown et al. (2001), Ilbert et al. (2005), Marchesini et al. (2007), and Liu et al. (2008), respectively. The open blue and filled cyan circles represent the rest-frame 0.1r-band (similar to our rest-frame V band) results at z ∼ 0.1 from the GAMA survey (Loveday et al. 2011) and the SDSS DR6 (Montero-Dorta & Prada 2009), respectively. The filled brown circle represents the SDSS rest-frame 0.1r-band results at z ∼ 0.1 from Blanton et al. (2003). The blue line in the top panel shows the weighted mean of the faint-end slopes from our work and Loveday et al. (2011), with the gray shaded area representing the error of the mean. The purple line is the theoretical prediction from Khochfar et al. (2007), whereas the dot-dashed black line is the best-fit model derived in Ryan et al. (2007); the solid black line represents the best fit derived by fitting the values of α from Loveday et al. (2011) and our work with α(z) = a + bz. The solid dark gray curves represent the best-fits of the evolution with redshift of M*V and Φ* (using the parameterizations introduced in Stefanon & Marchesini 2011) using the values from Loveday et al. (2011) and our work. The dashed dark gray curve in the bottom panel is obtained adopting the best-fit curves of the evolution with redshift of M*V and Φ*.