The Most Massive Galaxies at 3.0<z<4.0
in the NEWFIRM Medium-Band Survey:
Properties and Improved Constraints on the Stellar Mass Function
FIG.1. Observed SEDs of the mass-selected sample at 3.0≤z<4.0. Filled circles are the observed fluxes, in units of 10−19 erg cm−2 s−1 Å−1, with corresponding 1σ errors. The blue symbols are the photometric points from NMBS. The solid gray curves represent the best-fit EAZY templates. The dark gray filled regions represent the EAZY redshift probability functions. The vertical red line is the adopted redshift from EAZY (zpeak), while the shaded gray regions are the 1σ allowed values for the photometric redshifts. Also listed are the NMBS identification number, the adopted photometric redshift from EAZY, and the observed total K- and r-band magnitudes.
1/Vmax measurements [Table 5 from Marchesini et al. 2010]:
Maximum-likelihood measurements (adopting a Schechter 1976 function) [Table 6]:
Number and stellar mass density measurements [Tables 7 from Marchesini et al. 2010]:
Number density at 3.0<z<4.0, Stellar mass density at 3.0<z<4.0
Please, cite Marchesini et al. (2010) for any publications using these data (downloadable below).
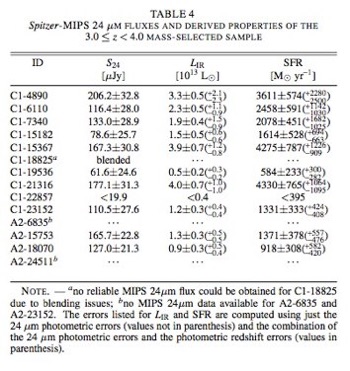
ABSTRACT: We use the optical to mid-infrared coverage of the NEWFIRM Medium-Band Survey (NMBS) to characterize, for the first time, the properties of a mass-complete sample of 14 galaxies at 3.0≤z<4.0 with Mstar>2.5×10¹¹ M⊙, and to derive significantly more accurate measurements of the high-mass end of the stellar mass function (SMF) of galaxies at 3.0≤z<4.0. The accurate photometric redshifts and well-sampled SEDs provided by the NMBS combined with the large surveyed area result in significantly reduced contributions from photometric redshift errors and cosmic variance to the total error budget of the SMF. The typical very massive galaxy at 3.0≤z<4.0 is red and faint in the observer’s optical, with a median r-band magnitude of ⟨rtot⟩=26.1, and median rest-frame U−V colors of ⟨U−V⟩=1.6. About 60% of the mass-complete sample have optical colors satisfying either the U- or the B-dropout color criteria, although ~50% of these galaxies have r>25.5. We find that ~30% of the sample has SFRs from SED modeling consistent with zero, although SFRs of up to ~1-18 M⊙ yr−1 are also allowed within 1σ. However, >80% of the sample is detected at 24 μm, resulting in total infrared luminosities in the range (0.5-4.0)×1013 L⊙. This implies the presence of either dust-enshrouded starburst activity (with SFRs of 600-4300 M⊙ yr−1) and/or highly-obscured active galactic nuclei (AGN). The contribution of galaxies with Mstar>2.5×10¹¹ M⊙ to the total stellar mass budget at 3.0≤z<4.0 is 8+13-3%. Compared to recent estimate of the stellar mass density in galaxies with Mstar≈109-1011 M⊙ at z~5 and z~6, we find an evolution by a factor of 2-7 and 3-22 from z~5 and z~6, respectively, to z=3.5. The previously found disagreement at the high-mass end between observed and model-predicted SMFs is now significant at the 3σ level when only random uncertainties are considered. However, systematic uncertainties dominate the total error budget, with errors up to a factor of ∼8 in the densities at the high-mass end, bringing the observed SMF in marginal agreement with the predicted SMF. Additional systematic uncertainties on the high-mass end could be potentially introduced by either 1) the intense star-formation and/or the very common AGN activities as inferred from the MIPS 24 μm detections, and/or 2) contamination by a significant population of massive, old, and dusty galaxies at z~2.6.
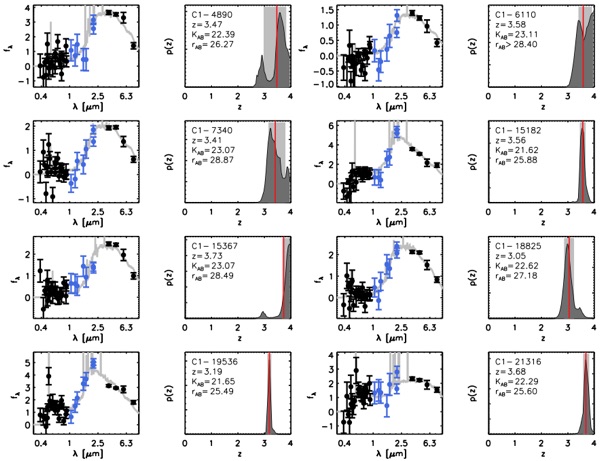
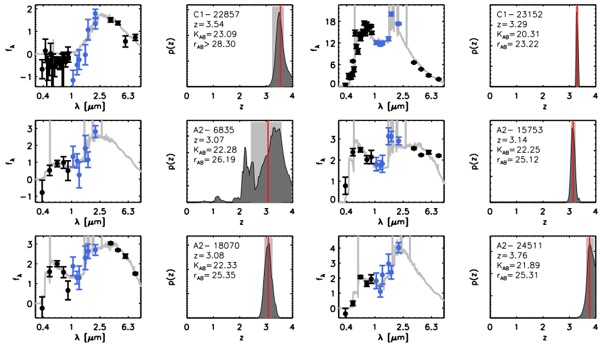
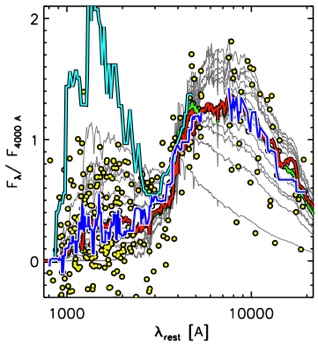
FIG.2. Rest-frame SEDs of the mass-selected sample at 3.0≤z<4.0 (yellow filled circles). The SEDs are normalized to the flux at λrest=4000 Å. The solid blue curve represents the running median of the 15 neighboring points. The best-fit FAST templates adopting the Bruzual & Charlot (2003) models are shown as dark gray solid curves. The green and red solid curves represent the median best-fit FAST templates adopting the Bruzual & Charlot (2003) and the Maraston (2005) models, respectively. The cyan solid curve represents the median SED of the H−K galaxies at z~3.7 from Brammer & van Dokkum (2007).
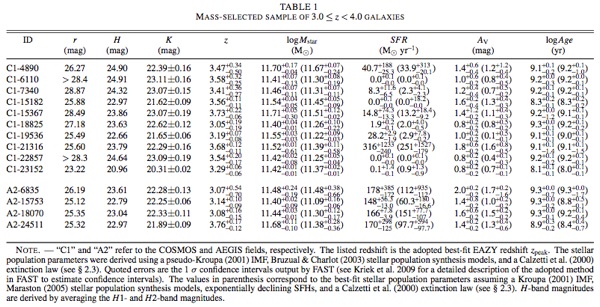
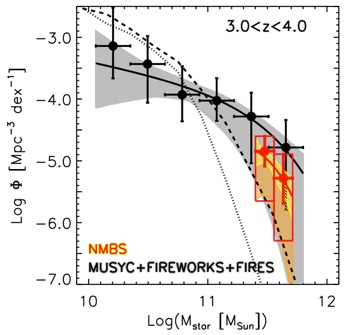
FIG.3. SMFs of galaxies at redshift 3.0≤z<4.0 from the NMBS (red, orange, and yellow symbols) and the analysis of Marchesini et al. (2009) (black and gray symbols). The filled symbols represent the SMF derived with the 1/Vmax method, with error bars showing the total 1σ random errors, including photometric redshift errors and field-to-field variations; the red boxes include also the systematic uncertainties due to the different SED-modeling assumptions adopted. The solid curves represent the SMFs derived with the maximum likelihood analysis, with shaded regions representing the 1σ uncertainties. The black error bars and gray shaded area include the systematic uncertainties due to different template sets in the photometric redshift estimate. The orange hatched area includes also the systematic uncertainties due to the different SED-modeling assumptions adopted in our analysis. The dotted and dashed black curves represent the predicted SMFs from the semi-analytic model of Somerville et al. (2008), where the dashed curve is derived from the dotted curve after convolution with a normal distribution of standard deviation of 0.25 dex. The NMBS allows us to derive more accurate measurements of the high-mass end of the SMF of galaxies at 3.0≤z<4.0.
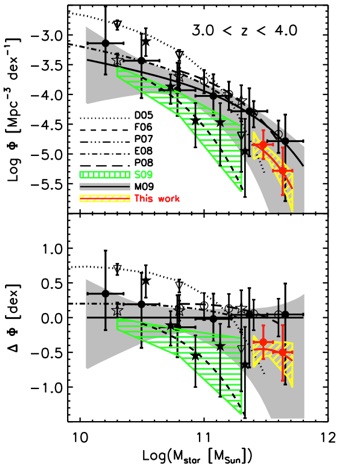
FIG.4. Top panel: Comparison between the SMF at 3.0≤z<4.0 (yellow and red) derived from this work and previous measurements from the literature, including the measurement from Marchesini et al. (2009) (gray and black). For the SMFs derived from this work and Marchesini et al. (2009), the filled circles represent the measurements using the 1/Vmax method, while the solid curves represent the measurements using the maximum-likelihood analysis; the 1σ error bars of the 1/Vmax measurements include Poisson errors, field-to-field variations, and uncertainties from photometric redshift uncertainties (both random and systematic). Similarly for the 1σ error of the maximum-likelihood measurements (yellow and gray regions). Previous works are plotted as filled stars and dashed curves (Fontana et al. 2006; F06); open circles and long-dashed curves (Pérez-González et al. 2008; P08); open stars and dot-dashed curves (Elsner et al. 2008; E08); open triangles and dotted curves (Drory et al. 2005; D05). The hatched green area shows the SMF of B-dropout galaxies from Stark et al. (2009). Bottom panel: Symbols as in the top panel, but now the differences between the SMFs measurements showed in the top panel and the SMF from Marchesini et al. (2009), ∆Φ=logΦ-logΦDM09, are plotted as a function of stellar mass to highlight the differences.
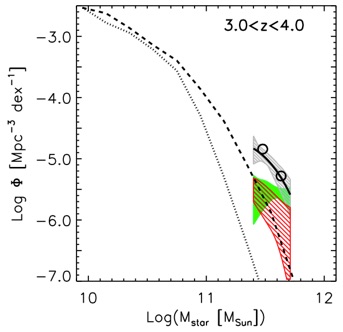
FIG.5. SMFs of galaxies at 3≤z<4.0 measured by adopting an additional old and dusty template in the estimate of the photometric redshifts. The gray hatched region, and the black solid line and empty circles represent the SMF measured adopting the default EAZY template set. The colored regions represent the SMFs derived by adopting the additional old and dusty template in the estimate of the photometric redshifts. The green region is obtained by using the Bruzual & Charlot (2003) stellar population synthesis models, while the hatched red region is obtained by using the Maraston (2005) models. The dotted and dashed curves represent the predicted SMFs from the semi-analytic model of Somerville et al. (2008).