The Evolution of the Stellar Mass Function of Galaxies from z=4 and the First Comprehensive Analysis of its Uncertainties:
Evidence for Mass-dependent Evolution
FIG.1. Top panel: SMFs of galaxies at redshift 1.3<z<2.0 (blue), 2.0<z<3.0 (green), and 3.0<z<4.0 (red). The filled symbols represent the SMFs derived with the 1/Vmax method, with error bars including only Poisson errors. The solid curves represent the SMFs derived with the maximum likelihood analysis, with shaded regions representing the 1σ and 2σ uncertainties. The arrows show the best estimates of M*star and the corresponding 1σ errors derived with the maximum likelihood analysis. The black solid curve and points represent the local (z∼0.1) SMF from Cole et al. (2001). Bottom panel: (α–M*star) parameter space derived from the maximum likelihood analysis. Filled circles are the best-fit values of α and M*star, while the curves represent their 1σ and 2σ contour levels; the colors are the same as in the top panel. The black filled square represent the redshift z∼0.1 value from Cole et al. (2001). Very little evolution of the shape of the SMF is observed from z=3.0 to z=1.3, and most of the evolution is in the characteristic density Φ*. The shape of the SMF at z=3.5 is different, characterized by a much steeper low-mass end slope. The characteristic stellar mass M* seems to have evolved little, if any, from z=2.5 to z~0.1.
1/Vmax measurements [Table 1 from Marchesini et al. 2009]:
1.3<z<2.0, 2.0<z<3.0, 3.0<z<4.0
Maximum-likelihood measurements (adopting a Schechter 1976 function) [Table 2]:
z~0.1, 1.3<z<2.0, 2.0<z<3.0, 3.0<z<4.0
1/Vmax measurements for the different SED-modeling assumptions [Table 4 from Marchesini et al. 2009]:
1.3<z<2.0, 2.0<z<3.0, 3.0<z<4.0
Maximum-likelihood measurements (adopting a Schechter 1976 function) for the different SED-modeling assumptions [Table 5 from Marchesini et al. 2009]:
1.3<z<2.0, 2.0<z<3.0, 3.0<z<4.0
Stellar mass density measurements [Tables 6 and 7 from Marchesini et al. 2009]:
z~0.1, 1.3<z<2.0, 2.0<z<3.0, 3.0<z<4.0, works from literature
Please, cite Marchesini et al. (2009) for any publications using these data (downloadable below).
ABSTRACT: We present the evolution of the stellar mass function (SMF) of galaxies from z=4.0 to z=1.3 measured from a sample constructed from the deep near-infrared Multi-wavelength Survey by Yale-Chile, the Faint Infrared Extragalactic Survey, and the Great Observatories Origins Deep Survey-Chandra Deep Field South surveys, all having very high-quality optical to mid-infrared data. This sample, unique in that it combines data from surveys with a large range of depths and areas in a self-consistent way, allowed us to (1) minimize the uncertainty due to cosmic variance and empirically quantify its contribution to the total error budget; (2) simultaneously probe the high-mass end and the low-mass end (down to ~0.05x the characteristic stellar mass) of the SMF with good statistics; and (3) empirically derive the redshift-dependent completeness limits in stellar mass. We provide, for the first time, a comprehensive analysis of random and systematic uncertainties affecting the derived SMFs, including the effect of metallicity, extinction law, stellar population synthesis model, and initial mass function. We find that the mass density evolves by a factor of ∼17+7-10 since z=4.0, mostly driven by a change in the normalization Φ*. If only random errors are taken into account, we find evidence for mass-dependent evolution, with the low-mass end evolving more rapidly than the high-mass end. However, we show that this result is no longer robust when systematic uncertainties due to the SED-modeling assumptions are taken into account. Another significant uncertainty is the contribution to the overall stellar mass density of galaxies below our mass limit; future studies with WFC3 will provide better constraints on the SMF at masses below 1010 M⊙ at z>2. Taking our results at face value, we find that they are in conflict with semi-analytic models of galaxy formation. The models predict SMFs that are in general too steep, with too many low-mass galaxies and too few high-mass galaxies. The discrepancy at the high-mass end is susceptible to uncertainties in the models and the data, but the discrepancy at the low-mass end may be more difficult to explain.
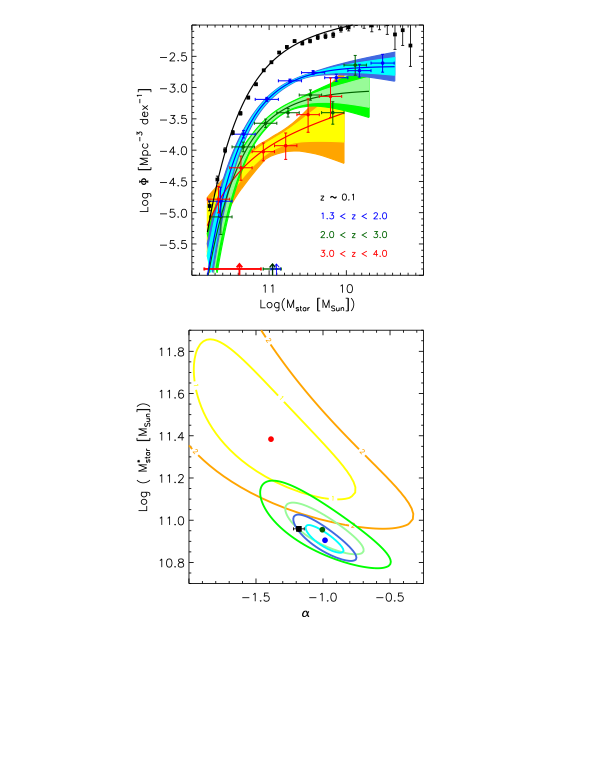
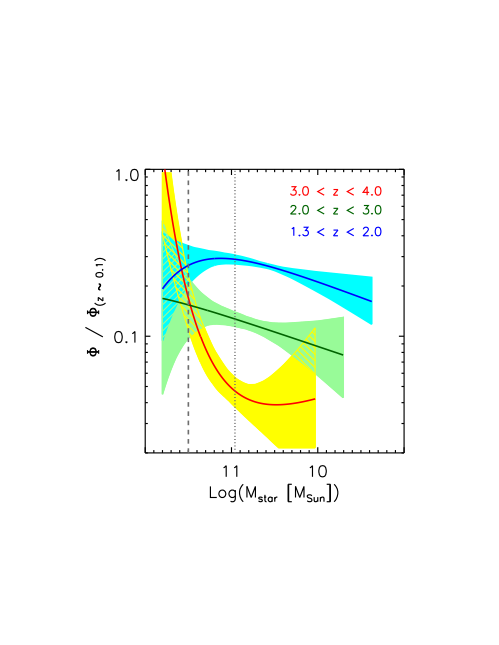
FIG.2. Ratio of the high-z SMFs (Φ) and the local SMF (Φz∼0.1) plotted as a function of the stellar mass as measured from the maximum likelihood analysis. The shaded regions represent the 1σ uncertainties. The vertical dashed and dotted lines represent the value of 3×10¹¹ M⊙ and the z=0.1 characteristic stellar mass, M*star∼1011 M⊙, respectively. Evidence for mass-dependent evolution is present, with the evolution to z∼0.1 being larger at the low-mass end and smallest for the most massive galaxies.
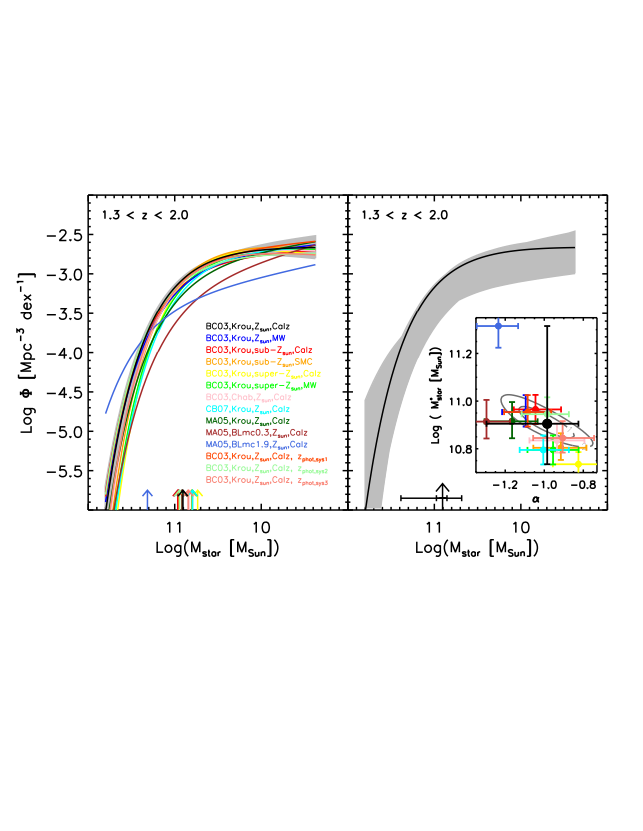
FIG.3. Left panel: SMF of galaxies at 1.3<z<2.0 derived with the maximum likelihood analysis. The SMF and its 1σ error corresponding to the default set of SED-modeling assumptions is plotted with black line and gray shaded region; the SMFs corresponding to different sets of SED-modeling settings and different combinations of template sets and template error functions are plotted with different colors (no errors plotted for clarity); the arrows represent the characteristic stellar masses M*star. Right panel: SMF of galaxies at 1.3<z<2.0 derived with the maximum likelihood analysis and assuming the default set of SED-modeling settings (black solid curve); the gray shaded region represent the total 1σ uncertainty, included the systematic uncertainties. The arrow represents M*star; the smaller error bars represent the 1σ error derived from the maximum likelihood analysis; the larger error bars represent the total 1σ error, with the systematic uncertainties added linearly. The insert shows the parameter space (α–M*star), with the best-fit values corresponding to the default set of SED-modeling settings (black filled circle) and its corresponding 1σ and 2σ contour levels (solid gray ellipsoids), and the best-fit values corresponding to the other SED-modeling assumption sets and different combinations of template sets and template error functions (colored filled circles). If the bottom-light IMFs are not considered, the largest systematic effects on the derived SMFs are caused by the changes in the stellar population synthesis models and the combination of super-solar metallicity with the MW extinction law. Much larger systematic effects are found when the bottom-light IMFs are adopted (brown and light-blue symbols), both at the high- and low-mass ends.
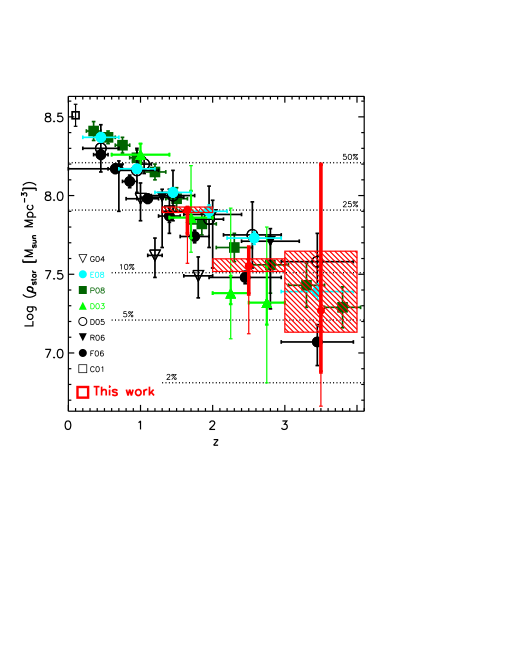
FIG.4. Evolution as a function of redshift of the global stellar mass density estimated by integrating the SMFs over the stellar mass range 108<Mstar/M⊙<1013 (the contribution to the total stellar mass density of galaxies with Mstar<108 M⊙ is negligible if the Schechter parameterization of the SMF is valid also at stellar masses smaller than probed by our sample). Red symbols represent the total stellar mass densities estimated in this work (shaded boxes do not include the systematic uncertainties, while error bars do; the thick error bars do not include the systematic effect of the two bottom-light IMFs, while the thin error bars do). The estimates of the total stellar mass densities from the literature were taken from Cole et al. (2001; open square); Dickinson et al. (2003; filled green triangles; thick error bars include random errors and cosmic variance alone, while the thin error bars include the systematic uncertainties due to different SED-modeling assumptions); Glazebrook et al. (2004; open upside-down triangles; error bars including Poisson errors only); Drory et al. (2005; open circles); Elsner et al. (2008; filled cyan circles); Fontana et al. (2006; filled circles); Perez-Gonzalez et al. (2008; filled dark green squares); and Rudnick et al. (2006; filled upside-down triangles; error bars including random errors and uncertainties due to cosmic variance). For the measurements from the literature, only Poisson errors and errors due to photometric redshift uncertainties (as derived in the corresponding work), are plotted without uncertainties due to cosmic variance and systematic errors, unless stated otherwise. The horizontal dotted lines represent 50%, 25%, 10%, 5%, and 2% (from top to bottom, respectively) of the total stellar mass density at z=0.1. The stellar mass density has increased by a factor of ∼17+7-10 , ∼9±1, and ∼4±0.2 from z=3.5, z=2.5, and z=1.65, respectively, down to z=0.1. A much stronger evolution with redshift of the stellar mass density is however allowed once the systematic uncertainties are taken into account.
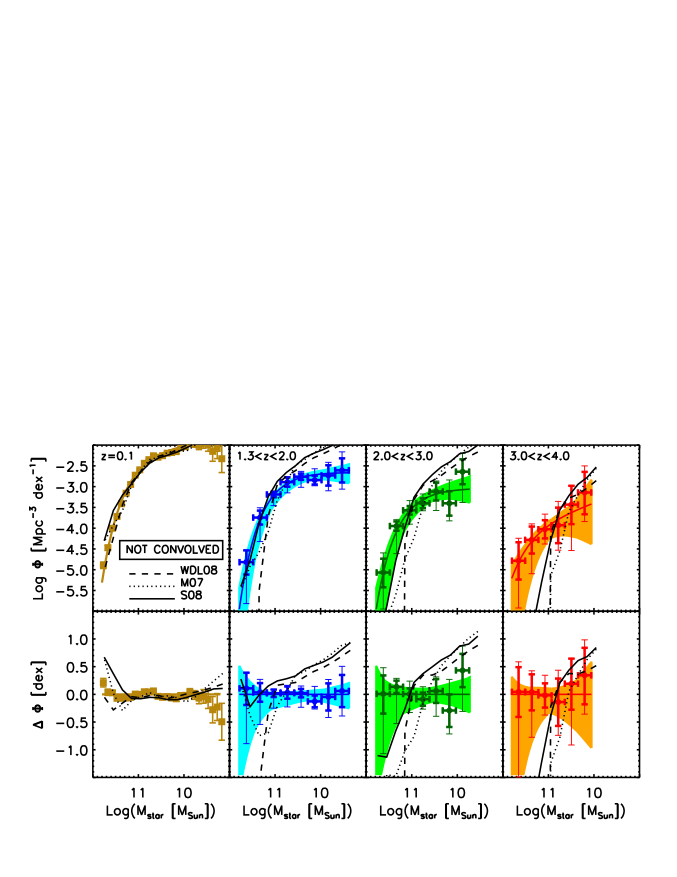
FIG.5. Comparison between the observed SMFs and the semi-analytic model-predicted SMFs not convolved with a normal distribution of standard deviation 0.25 dex. The predicted SMFs are represented by black curves: solid for the Somerville et al. (2008) model, dotted for the Monaco et al. (2007) model, and dashed for the Wang et al. (2008) model. Red, green, and blue filled circles represent the SMFs measured from the 1/Vmax method; the thick error bars include Poisson errors, cosmic variance, and the uncertainties from photometric redshift random errors; the thin error bars include the systematic uncertainties, with the exclusion of the effect due to the use of the bottom-light IMFs for consistency with the theoretical models. Red, green, and blue solid curves represent the SMFs measured from the maximum likelihood analysis. The shaded regions represent the total 1σ errors, including the systematic uncertainties. The top panels show the comparisons between the observed and the model-predicted SMFs. The bottom panels show the differences between the model-predicted SMFs and those derived in this work, ΔΦ(=logΦmodels)-(logΦours), plotted as a function of stellar mass. The SMFs predicted from the models are in general too steep, significantly over-predicting the number densities of galaxies below the characteristic stellar mass at all redshifts, and severely under-predicting the number density of the massive galaxies at z>2.0. The good agreement at z=0.1 is the direct result of the optimization of the free parameters in the models to match the z=0 universe.